 Software Development
 Security Services
 Cloud Services
 Other Services


 TechMagic Academy
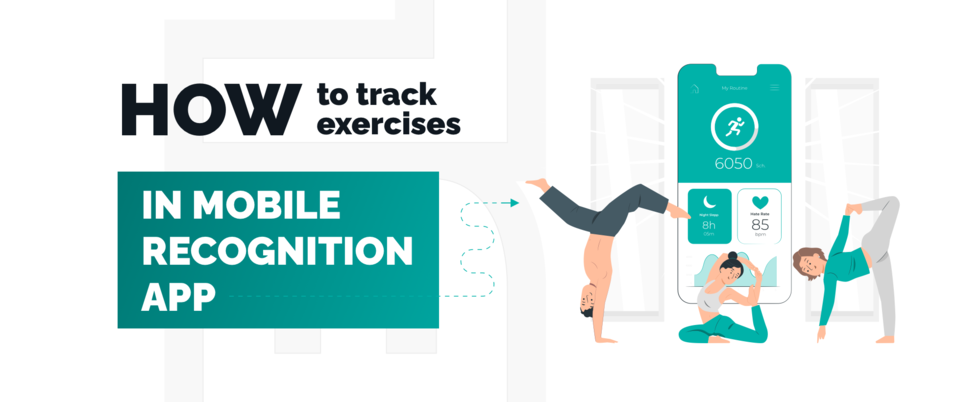
How to track exercises in mobile recognition app. Our Case-Study.

Content Marketing Manager at TechMagic. Mainly focused on content marketing, SEO optimization, and media relations.
Story behind Fitness applications are becoming more and more popular nowadays. Many of them can track your way while you’re running, monitor your heart rate, speed, etc. But every time you change your exercise you should make app be aware of that. This is a really good idea to
Story behind
Fitness applications are becoming more and more popular nowadays. Many of them can track your way while you’re running, monitor your heart rate, speed, etc. But every time you change your exercise you should make app be aware of that. This is a really good idea to click the button in an app and just do your workout without handling exercise changing so that app will understand what you’re doing also app should filter those movements that were done incorrectly.
The main idea of R&D was to develop program solution that will be able to distinguish pull-ups, squats and beams exercises. You don’t need to count a number of replies of a particular exercise and that makes your life easier.
Solution Idea
In order to distinguish exercises one from another, it is needed to track the motion of parts of user’s body. For this purpose, accelerometers fit well. The idea is to bind sensors to user’s head, legs, and hands. Those accelerometers will continuously transmit data about acceleration by 3 axises (x, y, z) to a mobile app via Bluetooth connection. Firstly user will do a requested number of replies of particular exercises for the app to record data about “how” particular user has done those exercises because every human has its body peculiarities that can significantly affect data which is got from accelerometers. Due to the mobile app development services, users can recognize exercise and filter inaccurate execution based on that collected data in app.
Challenges:
1. Data collecting
In order to try out solution idea, we used 3 smartphones (iPhone) with accelerometers inside. They were fixed at head, hand, and leg. Each of that phone was running app that was retrieving data from accelerometers and sending it to firebase service. Hence we have 3 phones that collect and send data we also need to synchronize that data so each phone sends timestamp along with acceleration data. After data is collected on firebase service it can be downloaded as CSV file and imported to Google Sheets to build charts.
A user was doing 3 types of exercise: pull ups, squats, and beams. For simplicity on charts lines represent only modulo value from each accelerometer.
X-axis contains time value (seconds). Y-axis contain “g” (9.80665 m/s2) multiplier. Y value equal to 1 means that there is no acceleration.
Chart for Pullups
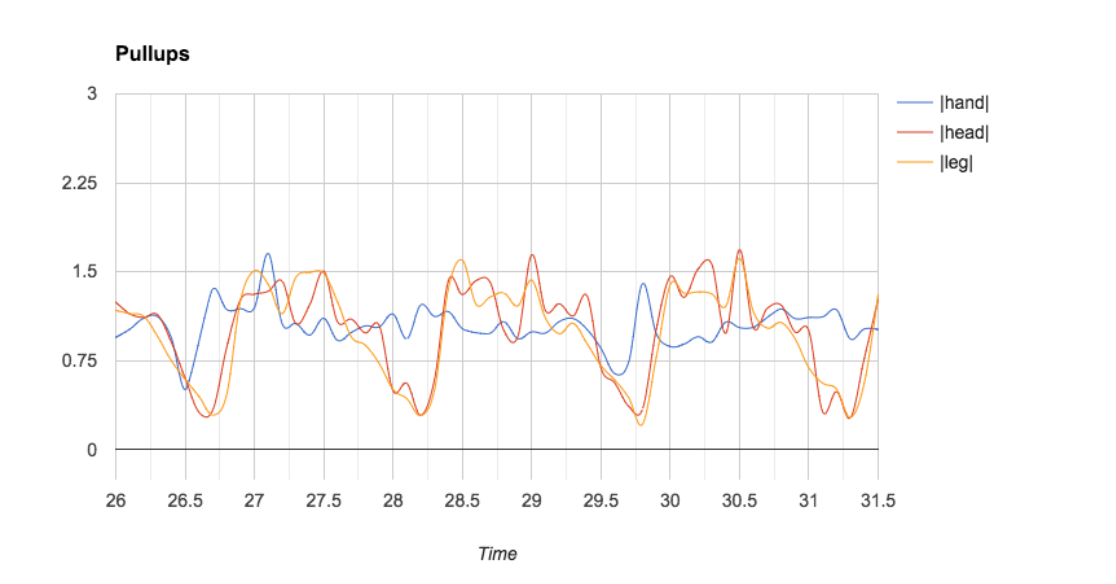
Chart for Beams
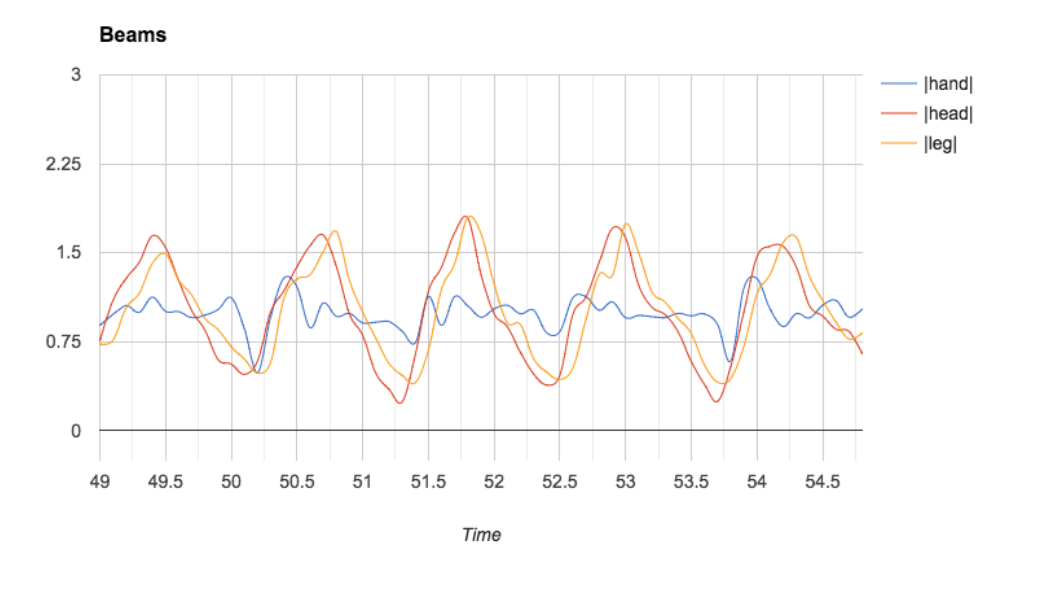
Chart for Squats
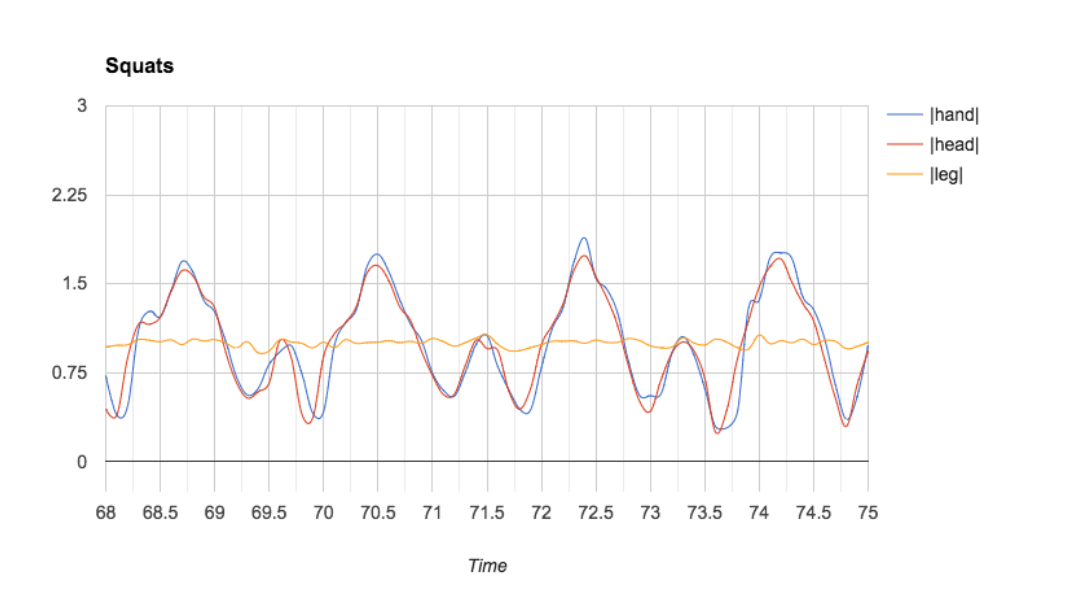
It is possible to notice that different exercise’s replies have their own relations between output data of accelerometers. For example, when a user does some squats hands and a head is moving in the same way with roughly the same acceleration and legs are not moving. It’s harder to distinguish beams from pull-ups because charts have similar form but in this situation, absolute values can help us to guess what exercise user is doing.
2. Android app development
The Android platform provides several sensors that let you monitor the motion of a device. Most Android-powered devices have an accelerometer, and many now include a gyroscope. Motion sensors are useful for monitoring device movement, such as tilt, shake, rotation, or swing. All of the motion sensors return multi-dimensional arrays of sensor values for each SensorEvent. For example, during a single sensor event, the accelerometer returns acceleration force data for the three coordinate axes, and the gyroscope returns rate of rotation data for the three coordinate axes. These data values are returned in a float array (values) along with other SensorEvent parameters.
The linear acceleration sensor provides a three-dimensional vector representing acceleration along each device axis, excluding gravity. It can be used to perform gesture detection.
The following code shows how to get an instance of the default linear acceleration sensor:
private SensorManager sensorManager;
private Sensor accelerometer;
sensorManager = (SensorManager) getSystemService(Context.SENSOR_SERVICE);
accelerometer = sensorManager.getDefaultSensor(Sensor.TYPE_LINEAR_ACCELERATION);
Conceptually, this sensor provides acceleration data according to the following relationship:
linear acceleration = acceleration - acceleration due to gravity
This sensor typically should be used if data without the influence of gravity is needed. The sensor coordinate system is the units of measure (m/s2).
When app is ready to retrieve regular updates regarding acceleration it should register listener:
sensorManager.registerListener(MainActivity.this, accelerometer, SensorManager.SENSOR_DELAY_FASTEST);
Here we register a listener, sensor to listen and updates period.
A listener should implement SensorEventListener interface which has method on-sensor changed (SensorEvent event) where new data should be processed.
@Override
public void onSensorChanged(SensorEvent event) {
     float accelerationX = event.values[0];
     float accelerationY = event.values[1];
     float accelerationZ = event.values[2];
     ...
 }
Firstly we need to filter the noise like this
if (Math.abs(accelerationX) < 1) { accelerationX = 0; }
if (Math.abs(accelerationY) < 1) { accelerationY = 0; }
if (Math.abs(accelerationZ) < 1) { accelerationZ = 0; }
Then, data is almost ready for sending. In order to synchronize data from different sensors, we need to add a timestamp to that data. And in order to be sure that we have the same time set on different android devices (even few seconds’ difference is not allowed in this case) we need to retrieve exact time from RTC service and calculate the offset.
long time = SNTP.currentTimeMillis();
currentAccurateDate = new Date(time);
timeStampDifference = time - System.currentTimeMillis();
After that, we can use timestamp difference each time we send timestamp
long timestamp = System.currentTimeMillis() + timeStampDifference;
Also, we want all timestamps to have 00 at the end and we don’t need to send data so frequently so we are using such code
long mod = timestamp % 100;
timestamp -= mod;
if (latestTimeStamp == timestamp) {
  return;
}
latestTimeStamp = timestamp;
After the data is ready we send it to firebase. Firebase database client is set this way
private FirebaseDatabase database;

database = FirebaseDatabase.getInstance();
database.setPersistenceEnabled(true);
And we send data when acceleration update is ready
DatabaseReference nodeReference = reference.child(String.valueOf(timestamp));

nodeReference.child(selectedBodyPart + "_x").setValue(accelerationX);
nodeReference.child(selectedBodyPart + "_y").setValue(accelerationY);
nodeReference.child(selectedBodyPart + "_z").setValue(accelerationZ);
nodeReference.child(selectedBodyPart + "_module").setValue(module);
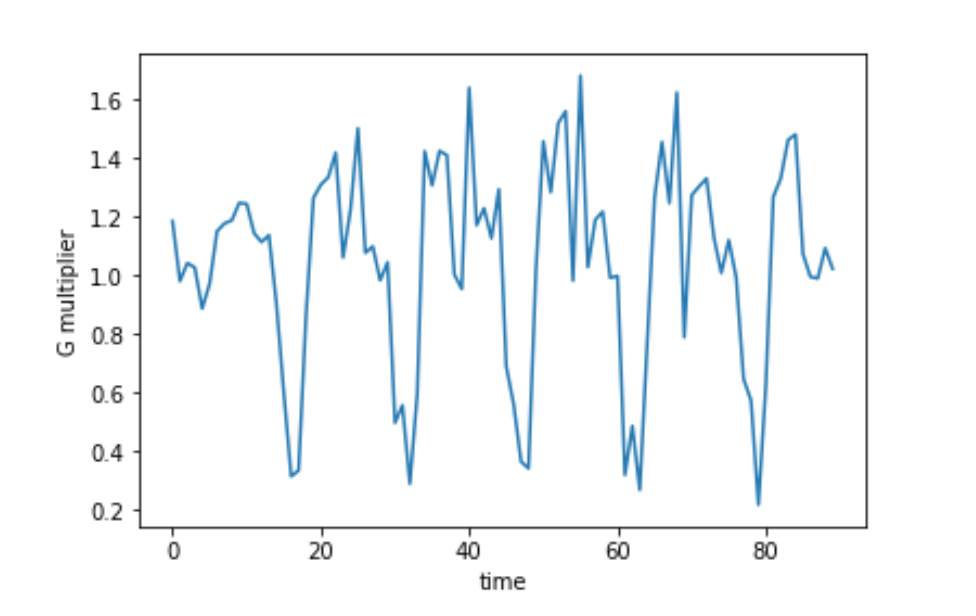
3. Gauze filter implementation.
One of the main problems that are obvious in such tasks is noise that appears in charts/values. The accelerometer is very sensitive, and it “feels” even slight movements that ideally should be ignored. Noise makes recognition process harder. In order to clear out that noise in values, we can use Gauze filter.
Before applying Gauze filter |head| values chart
After applying Gauze filter |head| values chart
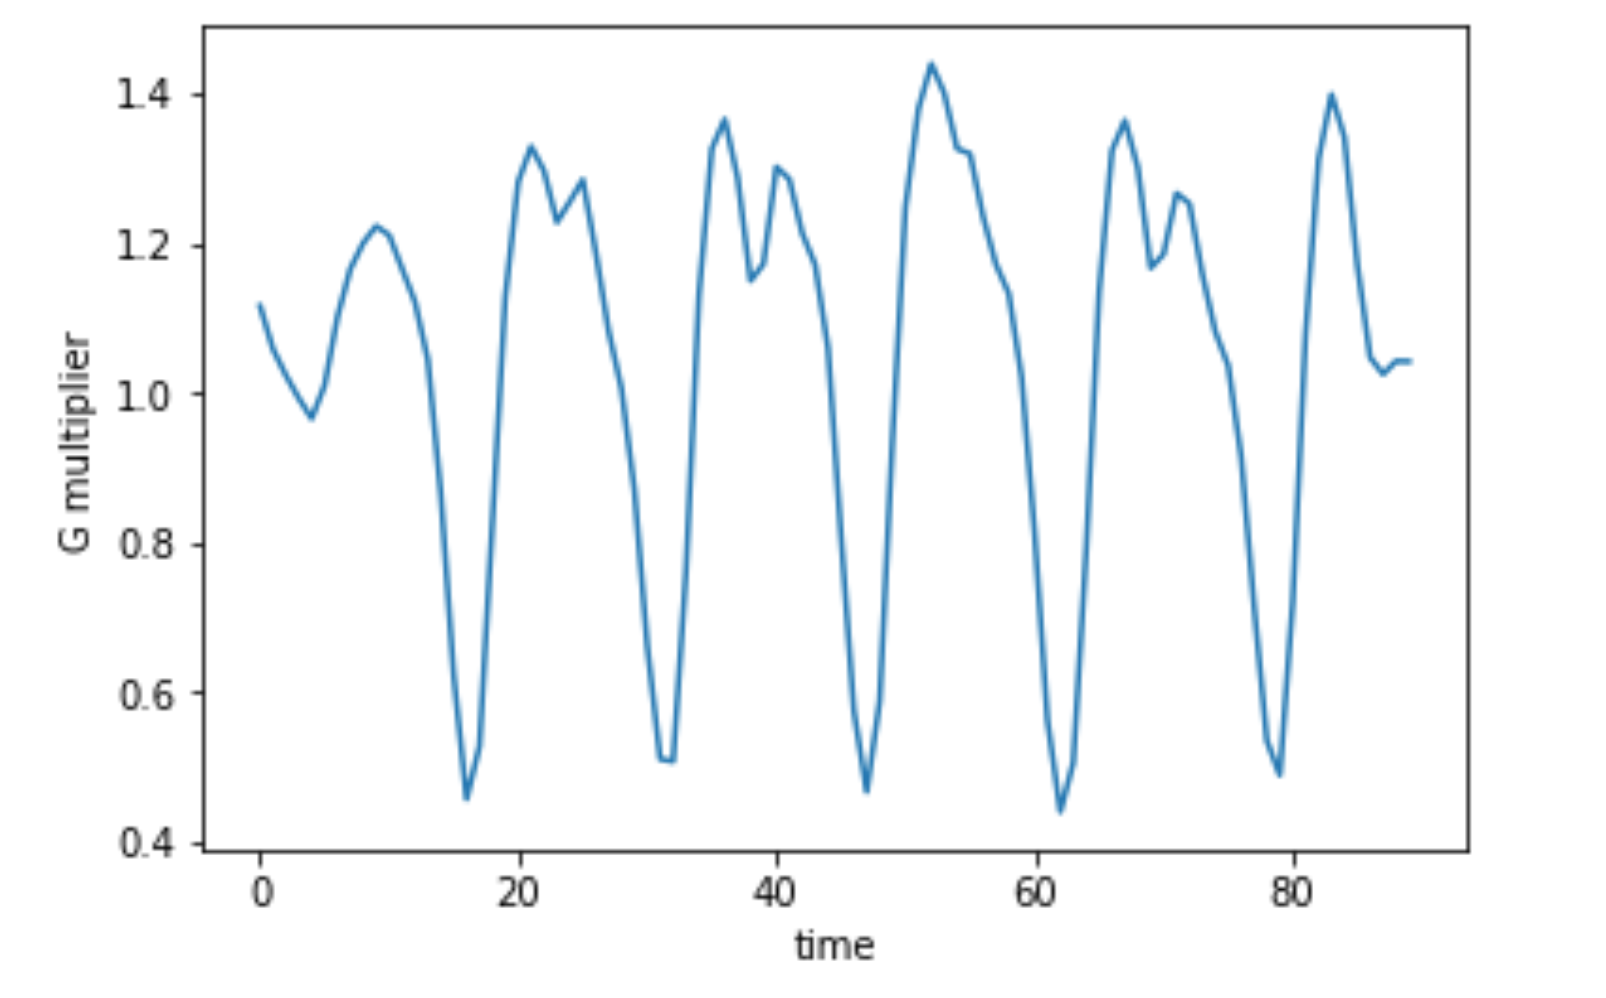
Here is python code that was used to filter noise.
df = pd.read_csv('/Users/user/Desktop/export_data.csv')
def drawGraph(df, low, top, name, colName):
    values = df[colName][low:top].values

    #here we apply gaussian filter
    filtered = gaussian_filter(values,sigma=1)

    plt.plot(filtered)
    plt.ylabel(name)
    plt.xlabel("time")
    plt.show()

drawGraph(df,250,340, "g multiplier", "|head|")
This code applies a gaussian filter to raw values and draws a chart for |head| values. The more value Sigma has the smoother chart will look.
Results
Based on collected data, it is possible to see/recognize exercises by a human, so it can be possible to develop an app that will do the same.
After applying Gauze filter values became more suitable for further analysis and recognition process.
Further general steps are:
Extract standard values for particular exercise for the user (it can be done by looking for extreme points on a chart or by looking for the moments of “silence” that the standard exercise reply will start with and end with).
Use standard reply values throughout workout data in order to recognize the same motion(reply) so app will be able to count them


 linkedin
 facebook
 twitter


