 Software Development
 Security Services
 Cloud Services
 Other Services


 TechMagic Academy
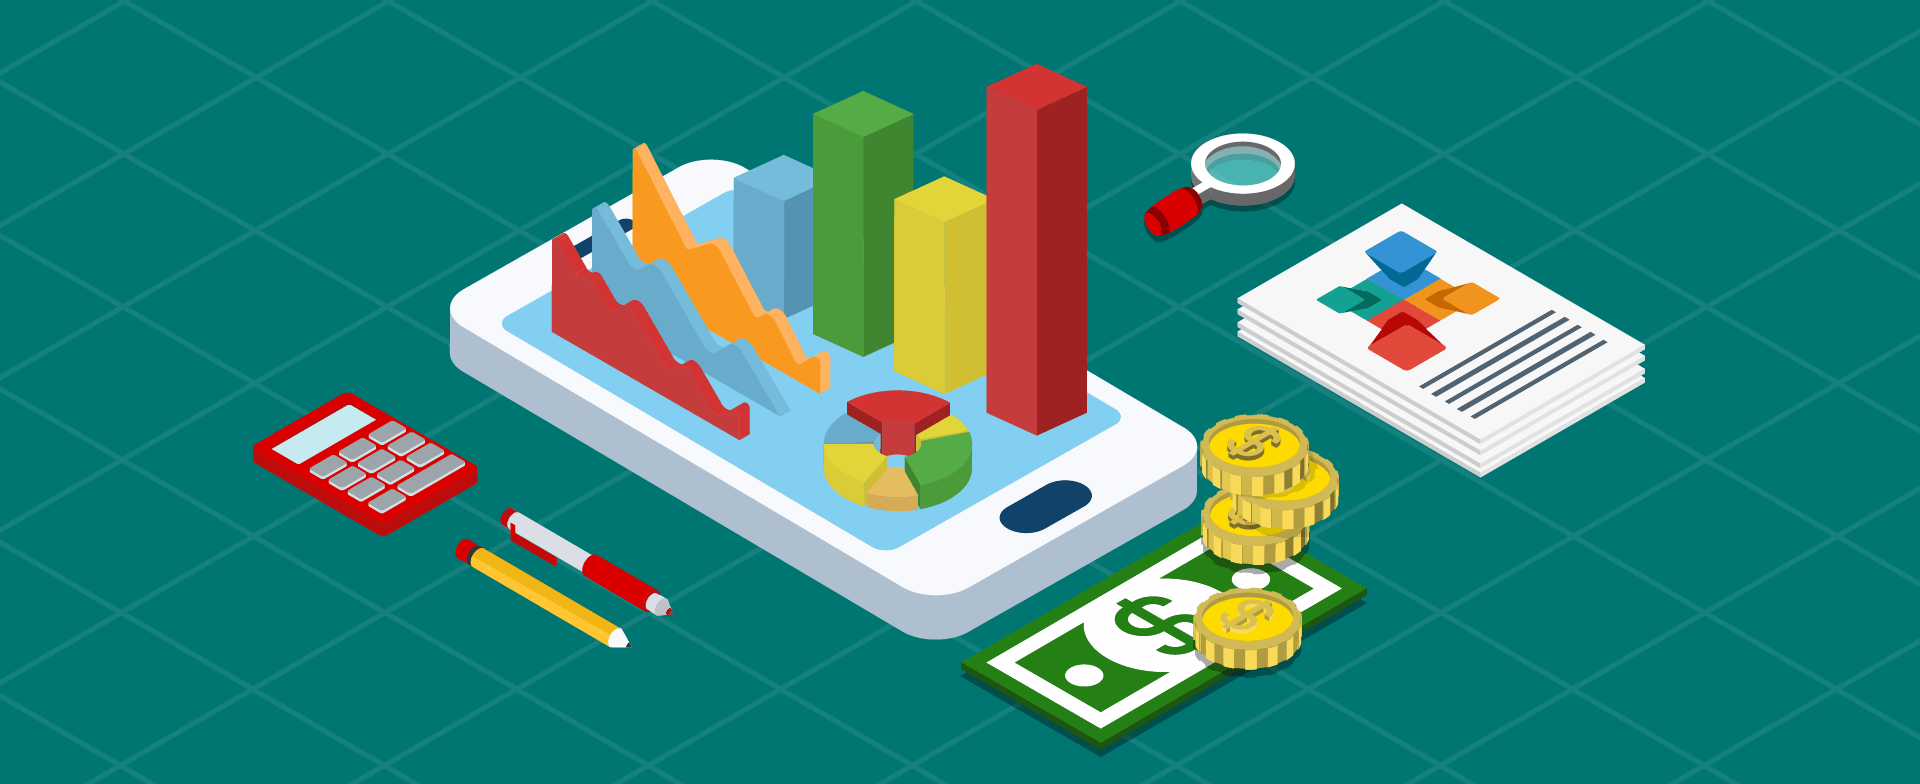
Mobile App Analytics - which tools to use?
Head of Marketing at TechMagic. Passionate about startups, digital ecosystem, cloud technologies, and innovations.
In a world of mobile apps, we all know and use only a very little part of what is available there for iOS and Android. Apple’s App Store and Google Play have more than 2 million apps each. But not all of them can be called famous or cool.
In a world of mobile apps, we all know and use only a very little part of what is available there for iOS and Android. Apple’s App Store and Google Play have more than 2 million apps each. But not all of them can be called famous or cool. Let’s try to figure out the nature and background of popular apps.
Analytics - what to track and measure?
Everything in our world is relative. The same thing is with mobile app success - how can we compare different apps and say which one is more successful? How can we understand the way to improve the level of success of particular app? We definitely need to use mobile app development services to have some metrics, gather the numbers and analyze them. This is actually what analytics is - the discovery, interpretation, and communication of meaningful patterns in data.
The most important metrics in our case are:
- Retention rate - ratio of number of users returning to the app at least 1 time in some period of time to the total number of users;
- Number of active users - daily/monthly, installs/uninstalls;
- Stability - number of crashes, number of errors;
- Average session length;
- Average revenue per user.
As far as this data is represented by numbers, let’s call it measurable. Talking about non-measurable data, we would bring your attention to lifetime value, user experience, and happiness while and after using the app.
Analytics - which tools to use?
Our experience working with analytics tools shows that implementing only one app is not enough for good data analysis. Multiple analytics services give an analyst different insights grabbed from the tracked data. Also, they allow an analyst to ensure that trends are correct and to avoid any sort of mistakes caused by corrupted data.
Here is a short list of tools that we use for analytics:
Google Analytics
It is the most powerful analytics tool available on the market. Everyone who used it will agree with that. It gives very flexible reports and a lot of insights. GA can be used both on mobile and web platforms. At some point using GA becomes not free, but it is definitely worth using this tool.
Firebase
This service has a lot of benefits inherited from GA. The biggest advantage is that Firebase Analytics was specifically developed for usage in mobile apps. It automatically gives you a lot of mobile-specific events without any additional work on the development side. This is really cool and, moreover, Firebase Analytics is completely free. When it comes to event data analysis (parameters, user properties) you need to export data from Firebase to BigQuery to be able to perform a more precise analysis.
Segment
The Segment has 2 basic features of analytics tool - events tracking and screens tracking. The main advantage is an ability to send data to hundreds of other analytics tools. Some tools may provide better abilities to analyze data or to gather insights. With an integration ability in Segment, you do not need to change anything on the client side, having it integrated to the other tools. Also, Segment provides a real-time debugging tool which shows the entire data that was sent from the client apps. It makes life simpler if you need to check that the data you track comes to the destination.
Appsee
This tool is mostly used for analyzing hit maps. Hitmap displays user’s clicks on each screen. This information is very useful because in this way you can catch some potential UI bugs or UX problems - some button has a too small clickable area, some UI elements appear to users as clickable, etc.
Fabric
For a great many of mobile developers, the first thing that comes to their minds hearing about Fabric is a crash. Yes, Crashlytics as a part of Fabric is a powerful tool for tracking crashes and errors in an app. Also, it brings very useful data about a number of users affected, crash log, device specs, OS version. You are able to see the dynamics of crashes for a certain period of time. You can also close some issue if it was fixed and see if it regressed in the next versions. In a case when an amount of crashes grows quickly, Crashlytics fires an alert and sends it via email. So you will not miss something critical happens in your app.
Fabric gives a possibility to check the adoption rate - a percentage of users who have the latest version of the app installed. It is very valuable data in some cases. Also, a lot of other statistics (DAU, New Users, etc) can be sent by Fabric on daily basis in very user-friendly format. So you can be aware of some interesting changes in the numbers.
Analytics - implementation tips
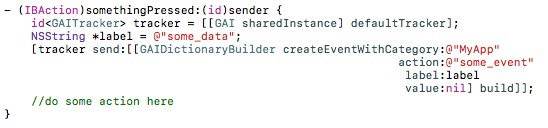
You have probably seen such pieces of code in some of your projects:
Or something like this (for Android):
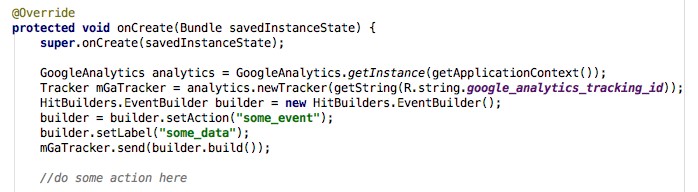
Looks like nothing wrong with the code. But what if you decide to add one more or two more trackers and track the same events with the same data? Correct, it would be time-consuming to develop and will produce a lot of code. From our experience, we suggest implementing the following abstraction layer to easily add or remove tracking events and add or remove parameters from the events being tracked.
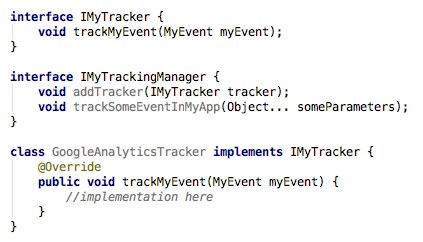
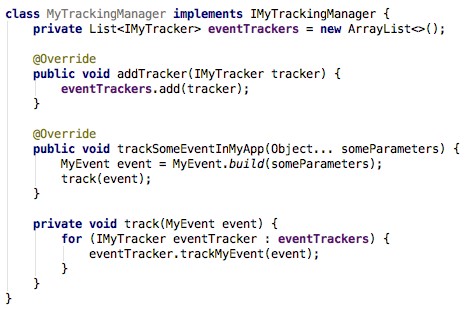
Having the above implementation installed some event tracking can look like this:
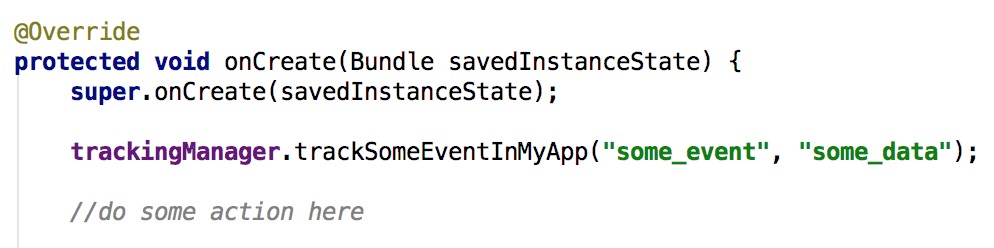
From our perspective, it looks extendable, clean and clear.
Usually, events and description of data that are needed to be tracked are provided by a growing team. But it is really cool if a development team understands the purpose of each piece of information and makes suggestions on how to extend the tracked data or improve events list. You are on a right way if your team makes such suggestions. Everybody has to understand that the more appropriate knowledge about user’s flows in an app we have, the more we can improve these flows and make using our app better again and again.


 linkedin
 facebook
 twitter


