 Software Development
 Security Services
 Cloud Services
 AI Services
 Other Services















 TechMagic Academy


Patient Data Interoperability Statistics for 2026
Last updated:10 September 2026


In 2025, 96% of US non-federal acute care hospitals electronically sent summary-of-care records to other organizations. In the same survey, 79% could integrate a record they received without manual entry, and that number has not moved since 2023. The plumbing works. What happens at the far end of the pipe is a different question.
If you are building a product that exchanges clinical data, you need current numbers for three jobs: sizing an opportunity, justifying integration spend, and answering a health-system buyer’s due-diligence questions. Most available figures are scattered across government data briefs or recycled through vendor blogs with no date attached, which makes them useless for all three.
Electronic health records are close to universal in the United States now, so the interesting question has shifted. It is no longer whether healthcare providers have digital patient records, but whether those records reach the next system in a usable state. Healthcare organizations that can exchange healthcare data cleanly and those that merely transmit it look identical in most adoption statistics.
Health data interoperability is now less a question of whether healthcare systems can connect and more a question of what arrives, in what shape, and whether anyone can act on it.
In this article, we cover how many hospitals actually exchange data, whether that data gets used, how many patients reach their own records, how far Fast Healthcare Interoperability Resources (FHIR) adoption has gone, what moves through national exchange networks, and where Artificial Intelligence genuinely fits.
Key Takeaways
-
76% of US non-federal acute care hospitals engaged in all four domains of interoperable exchange (send, receive, find, integrate) in 2025, up from 23% in 2014 (ASTP/ONC, 2025 AHA Health IT Survey). The global health data interoperability market was valued at $103.9 billion and is growing rapidly.
-
Integration is the weak link. Sending reached 96% in 2025, while integrating without manual entry stayed at 79%, statistically unchanged since 2023 (ASTP/ONC). Poor interoperability costs the U.S. healthcare system an estimated $30 billion annually.
-
Barriers are falling fast. Between 2023 and 2025, hospitals reporting data-formatting problems dropped from 41% to 25% and patient-matching problems from 31% to 19% (ASTP/ONC, 2025 AHA Health IT Survey).
-
65% of individuals were offered and accessed their online medical record or patient portal in 2024, up from 25% in 2014. 59% had records spread across multiple portals (ASTP Data Brief No. 77, 2024).
-
81% of hospitals enabled patient access through apps meeting API specifications in 2024, and 70% through apps meeting FHIR specifications (ASTP Data Brief No. 79, August 2025).
-
More than one billion health records have moved through the TEFCA network, up from 10 million in under a year (HHS, 26 June 2026).
-
Perceived information blocking is falling. Health information organizations reporting any perceived blocking dropped from 91% in 2019 to 71% in 2025 (ASTP Data Brief No. 85, June 2026).
-
Hospitals now run four exchange channels in parallel, up from 2.7 methods to 4.1 in 2025 (ASTP/ONC Quick Stat, August 2026).
How We Gathered These Statistics
Every figure on this page comes from a named government survey, an official announcement, or peer-reviewed research. Each one carries the source, the period the data covers, and a link to the original document. We used no vendor marketing data, no market-research estimates, and no blended or averaged numbers.
US federal figures come from the Department of Health and Human Services (HHS) and its agencies. Peer-reviewed findings come from the Journal of the American Medical Informatics Association (JAMIA), which is where most published research on record matching and data mapping appears.
Most US hospital figures come from the American Hospital Association (AHA) Annual Survey Information Technology Supplement, the main national source of health information technology data, published by the Assistant Secretary for Technology Policy / Office of the National Coordinator for Health IT (ASTP/ONC). Response rates matter for reading these numbers, so we name them: the 2025 survey had a 54.5% response rate among non-federal acute care hospitals, and the 2024 supplement covered 2,253 hospitals at a 51% response rate.
Every figure is the most recent official release for that measure, and each one is labelled with the year its data covers. We do not substitute a newer number taken from a different survey question to make a measure look fresher than it is.
One caution applies throughout. ASTP/ONC publishes two different measures of hospital exchange: “sometimes or often” engagement, and “routine” engagement. They are not comparable, and mixing them produces figures that look like a trend but are not one. Where we use the routine measure, we say so.
Top Patient Data Interoperability Statistics You Should Know in 2026
-
76% of US non-federal acute care hospitals engaged in all four exchange domains in 2025, against 23% in 2014 (ASTP/ONC Quick Stat).
-
Sending summary-of-care records: 96% in 2025, up from 78% in 2014 (ASTP/ONC).
-
Receiving: 93% in 2025, up from 56% in 2014 (ASTP/ONC).
-
Finding external records: 94% in 2025, up from 48% in 2014 (ASTP/ONC).
-
Integrating received records without manual entry: 79% in 2025, up from 40% in 2014 and statistically unchanged since 2023 (ASTP/ONC).
-
65% of individuals were offered and accessed their patient portal in 2024, and 57% used an app to reach their records (ASTP Data Brief No. 77).
-
59% of individuals had multiple online medical records or portals in 2024; 7% used an app to combine them (ASTP Data Brief No. 77).
-
95% of office-based physicians used an electronic health record (EHR) in 2024, and 91% used a certified EHR, per ASTP/ONC’s final reporting on this measure (ASTP Data Brief No. 84, June 2026).
-
More than one billion records were exchanged through TEFCA as of June 2026, up from 10 million a year earlier (HHS).
-
11 Qualified Health Information Networks (QHINs) were designated as of July 2026 (TEFCA RCE, The Sequoia Project).
-
In 2025, hospitals could send to most or all external hospitals at 54%, but to behavioral health facilities at only 22% (ASTP/ONC).
-
80% of hospitals were participating in or planning to participate in TEFCA in 2025, up from 20% aware and participating in 2022 (ASTP/ONC).
-
The mean number of methods hospitals often use to obtain external information rose from 2.7 to 4.1 in 2025 (ASTP/ONC Quick Stat).
-
Hospitals reporting that an exchange partner’s different EHR vendor was a barrier halved between 2023 and 2025, from 19% to 10% (ASTP/ONC).
-
Health information organizations reporting any perceived information blocking fell from 91% in 2019 to 71% in 2025 (ASTP Data Brief No. 85).
-
2,450 information blocking claims were logged between April 2021 and July 2026 (ASTP/ONC).
-
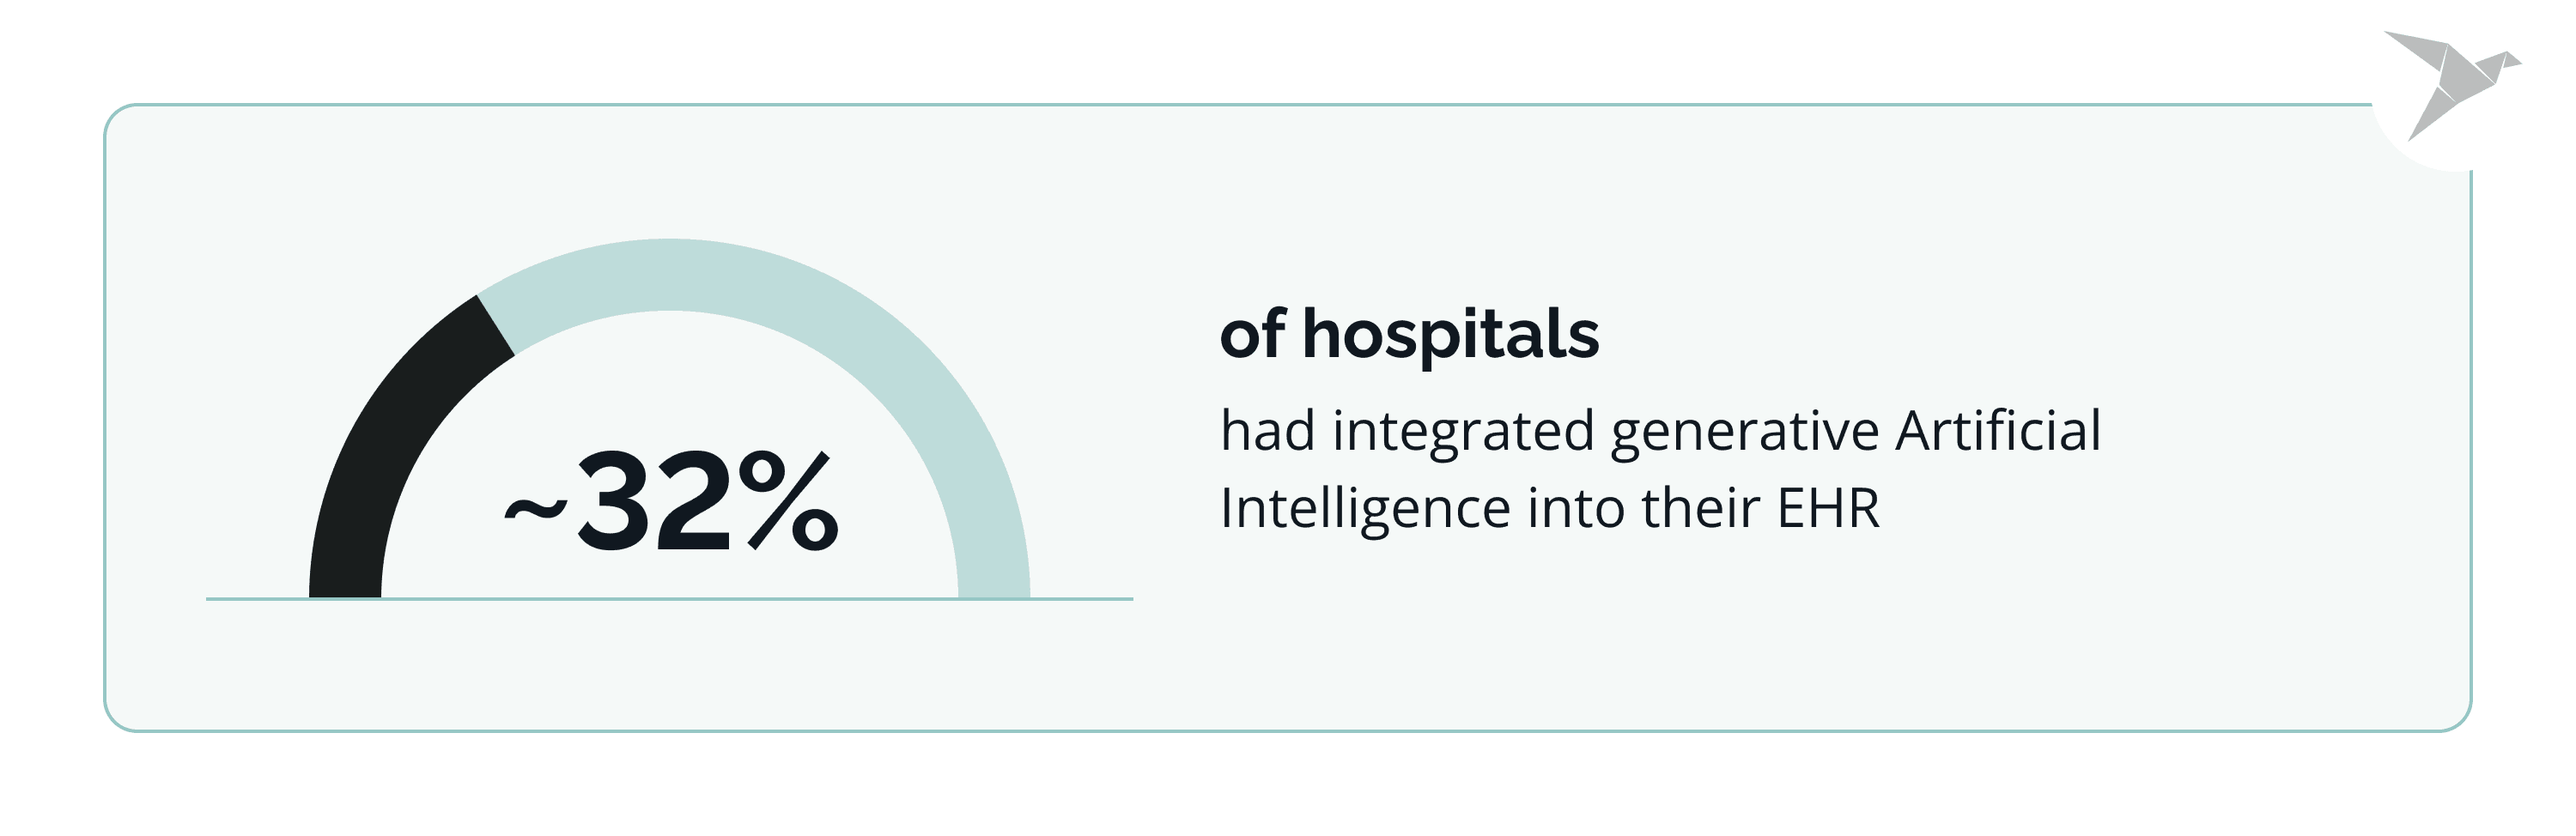
31.5% of hospitals had integrated generative Artificial Intelligence into their EHR, with 24.7% planning to do so within a year (JAMA Network Open, December 2025).
How Many Hospitals Actually Exchange Patient Data?
In 2025, 76% of US non-federal acute care hospitals engaged in all four domains of interoperable exchange, according to the ASTP/ONC Quick Stat drawing on the 2025 AHA Health IT Survey. In 2014, that figure was 23%.
Sending, receiving, finding, and integrating
ASTP/ONC measures four separate capabilities, and hospitals perform differently across them. The 2025 figures:
-
Send (pushing a summary-of-care record to another organization): 96%
-
Find (querying electronically for patient information from outside sources): 94%
-
Receive: 93%
-
Integrate (the EHR incorporating a received record without manual entry): 79%
Three of the four sit above 90%. The fourth does not, and that gap is where most integration work actually lives.
The growth trend since 2014
Every domain has climbed over the decade. Sending went from 78% to 96%, receiving from 56% to 93%, finding from 48% to 94%, and integrating from 40% to 79%.
ASTP/ONC also reports the direction of recent movement. In its own words, rates of hospital engagement in electronically sending, receiving, and finding information increased significantly between 2023 and 2025 (p<0.05), while rates of integrating information remained stable. Three lines moved. One did not.
How hospitals actually obtain outside data
Hospitals are not settling on one channel; they are stacking them. In an August 2026 release, ASTP/ONC reported that the mean number of methods hospitals often use to obtain external information rose from 2.7 to 4.1 in 2025, an increase of nearly 50%, with electronic methods going from 2.0 to 3.4 and network-based methods from 1.1 to 1.9.
The 2025 method mix, published in February 2026 across 2,351 responding hospitals, shows why. For sending, national networks and state, regional, or local health information exchanges each led at 60%, followed by EHR vendor networks at 55% and Direct messaging at 53%. Mail or fax was still an often-used sending method at 40%.
Four channels running in parallel is the current normal. If you are planning a single integration path, that number is the argument against it.
Where integration still breaks down
Integration is both the lowest of the four domains and the only one that has stopped improving. For anyone building healthcare products, this is the most useful number on the page.
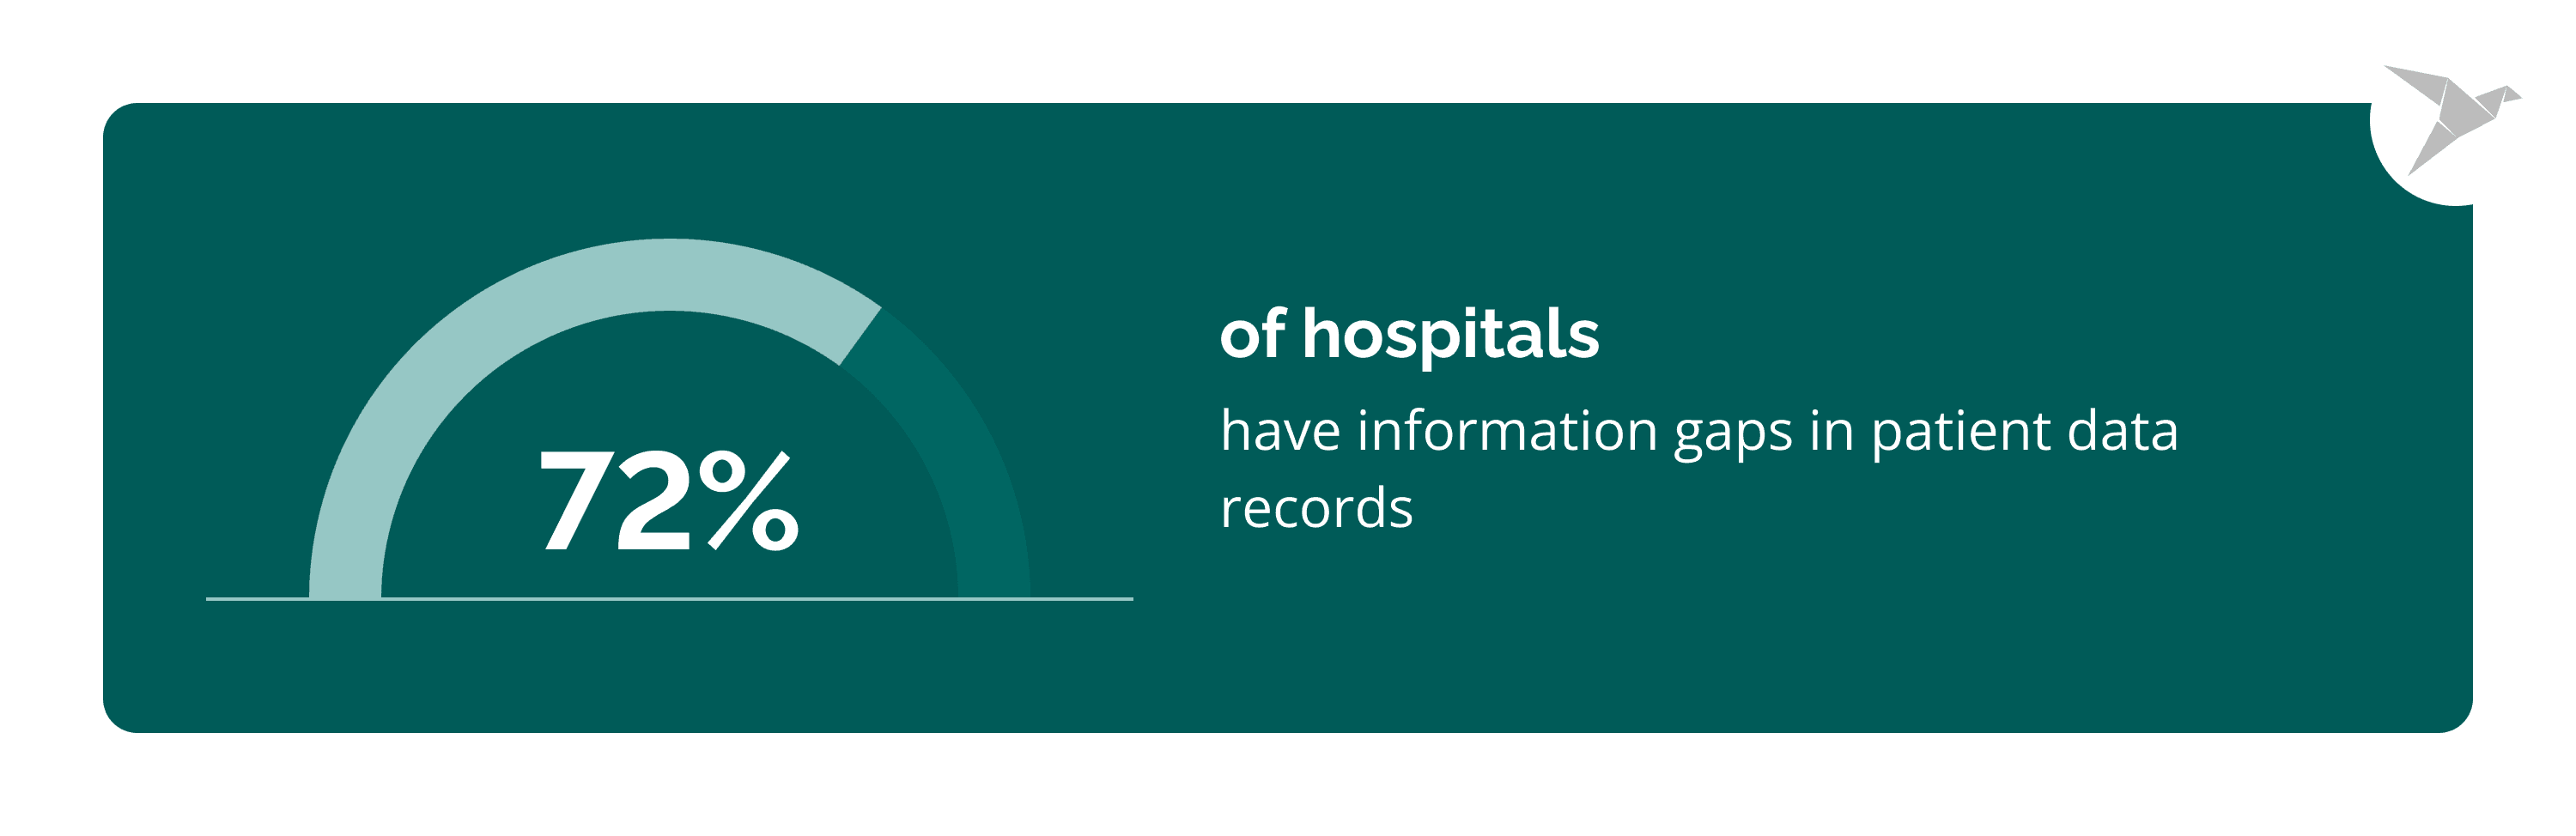
72% of hospitals have information gaps in patient data records. A record that arrives but cannot be integrated becomes manual data entry for someone. The exchange succeeded on paper and failed in the workflow, which is why counting successful transmissions overstates how much interoperability a health system actually has.
This is also where data silos survive the move to digital. Legacy systems that accept a message without absorbing it leave the receiving organization with the same fragmented view it had before, and the effect lands on patient care rather than on a dashboard.
The distinction underneath the number is the difference between four levels.
-
Foundational interoperability moves data from one system to another without interpreting it.
-
Structural interoperability means the receiving system can parse the message format.
-
Semantic interoperability means it understands what each field means.
-
Organizational interoperability, the layer above all three, covers the agreements and policies that let two organizations exchange electronic health information at all.
Most hospitals reported electronic exchange years ago. The 79% integration figure is what happens when the first two levels are solved, and the third is not.
A record can clear the first level and fail the second. It arrives, parses correctly, and still cannot be integrated, because the codes inside it do not map to anything the receiving EHR recognizes. The 79% figure is where that failure shows up in the national data.
What Still Blocks Patient Data From Being Used?
The barriers are real, measured, and shrinking. In ASTP/ONC’s February 2026 reporting on the 2025 AHA Health IT Survey, the share of hospitals reporting that data formatting problems get in the way of using outside information fell from 41% in 2023 to 25% in 2025, and patient matching problems fell from 31% to 19%.
What improved between 2023 and 2025
ASTP/ONC’s own summary of the trend is blunt: “major barriers that prevent exchange are diminishing.” Three of the measured frictions moved clearly across those two survey years:
-
Data formatting: 41% to 25%
-
Patient matching: 31% to 19%
-
Customized interfaces required: 43% to 39%
Standardized data formats are the reason the first line moved that far. When exchange partners agree on a structure, the receiving hospital system stops writing translation logic for every connection, which is the whole argument for enabling seamless data exchange through national networks rather than point-to-point interfaces.
What did not improve
Customized interfaces barely moved and remain the most-reported friction. Bespoke interface work is still the tax on every integration, and it is not going away on the current trend.
That figure sits alongside the integration number from the section above. Sending reached 96% in 2025 while the ability to integrate electronic health information without manual entry stayed at 79%. The barriers to moving data are falling. The barrier to absorbing it is not.
What incomplete records cost
Two peer-reviewed findings put a price on the gap. In a 2025 survey of clinicians across eight health systems, 37.5% of emergency medicine providers reported ordering duplicate diagnostic tests daily or more often because they could not reach prior results, against 16.0% of inpatient internal medicine clinicians. Emergency efficiency depends on reaching a complete patient history during a critical intervention, and clinicians report re-ordering tests when they cannot.
Patient safety is the sharper edge. A January 2026 JAMIA Open review of 148 studies found that failures to match a person to their single correct record produce unnecessary procedures, medication, and testing, along with delayed care. Its documented cases of medical errors include a newborn given the mother’s medication after a name confusion and a resuscitation decision taken from the wrong record. Its strongest recommendation is that organizations monitor and rapidly remediate errors stemming from any failure to maintain one unique medical record per patient.
Where exchange is thinnest: care settings outside the hospital
National averages hide a steep drop-off past the hospital walls. In February 2026, ASTP/ONC reported how far hospitals could exchange with each type of partner in 2025. Sending to most or all partners: external hospitals 54%, ambulatory providers 42%, long-term and post-acute care facilities 24%, and behavioral health facilities 22%. Receiving ran higher across the board, at 71%, 69%, 45%, and 43% respectively.
Two things stand out. Hospitals receive more readily than they send, and the drop from hospital-to-hospital exchange to behavioral health exchange is better than two to one in the same survey year. Exchange with external ambulatory care providers sits in between, closer to the hospital end than to behavioral health providers.
The other side of that connection explains why. A 2026 ASTP data brief on substance use and mental health treatment facilities found 31% had no capability to search or query for external information at all, and 56% had to manually enter clinical information they received electronically. Only 31% were actively exchanging information through a health information organization.
Care transitions to skilled nursing, rehabilitation, and behavioral health are exactly the moments when relevant patient health information is hardest to reconstruct and most consequential for patient outcomes. They are also where health data sharing is weakest.
Policy is moving here. ASTP/ONC recently announced behavioral health data exchange pilots in February 2026: nine programs and 45 exchange partners across nine states and Washington, D.C., testing a behavioral health dataset and FHIR implementation guide.
Which hospitals exchange, and which do not
Capability is not spread evenly, and the gaps track resources. ASTP/ONC’s most recent subgroup data, published in 2026, shows the pattern on two different measures.
On patient access through standards-based APIs, ASTP Data Brief No. 81, published February 2026, found system-affiliated hospitals at 77% against 57% for independent hospitals, and medium-to-large hospitals at 75% against 67% for small ones.
ASTP/ONC has not published a 2025 breakdown of how many hospitals reported routine access by hospital type, so these two measures are the best available proxy. On predictive Artificial Intelligence, its February 2026 reporting shows the spread is wider still: small hospitals under 100 beds at 59%, medium at 80%, and large hospitals over 400 beds at 96%.
A national average describes a market that is really two markets. Independent, rural, and critical access hospitals sit consistently at the lower end of both measures. If your product serves them, design for the lower number in each pair rather than the national figure.
How Many Patients Can Access Their Own Records?
In 2024, 65% of individuals were offered and accessed their online medical record or patient portal, according to ASTP Data Brief No. 77, drawing on the Health Information National Trends Survey. The share has more than doubled in a decade, from 25% in 2014.
Portal access and the ten-year trend
Patient-facing access is now mainstream rather than an early-adopter behavior. That changes what a data error costs, because a mismatched or missing record is now visible to the person it describes.
App-based access
How people reach their records has shifted as well. In 2024, 57% used an app to access their records, up from 51% in 2022 and 38% in 2020. Web-only access fell over the same period, from 60% in 2020 to 42% in 2024.
The fragmentation problem
Access is not the same as having your health data in one place. In 2024, 59% of individuals had multiple online medical records or portals. Only 7% reported using a portal-organizing app to combine information from different portals into one place, up from 2% in 2022.
Most people with digital access to their records hold them in pieces across separate systems. Patient health information availability is no longer the constraint; assembling it in one place is.
Fragmentation moved from the provider side to the patient side rather than disappearing, and data sharing between those portals is what would close it. Health information exchange organizations and national networks address this on the provider side; nothing equivalent yet consolidates the patient’s own view.
How Widely Are FHIR APIs Actually Adopted?
In 2024, 81% of hospitals enabled patient access using apps configured to meet application programming interface (API) specifications, and 70% enabled access through apps meeting FHIR specifications. Both figures come from ASTP Data Brief No. 79, published August 2025 and reporting 2024 AHA IT Supplement data from 2,253 hospitals at a 51% response rate.
API and FHIR-enabled patient access
FHIR-based access is now the majority position among US hospitals, though it trails general API access by 11 points. A hospital can meet an API requirement without the modern standard underneath it, which is worth knowing when a buyer tells you they are “API-enabled.”
The EHR developer divide
ASTP/ONC reports a substantial split by EHR developer. Hospitals using what the brief calls the market-leading EHR developer enabled app-based patient access at 92%, against 70% for other hospitals. For FHIR-configured apps specifically, the split was 83% against 56%.
We report this as ASTP/ONC framed it and name no vendors. The practical read is that your integration experience will vary by which of the major EHR systems a customer runs, and by a wide margin. Ask which platform a prospect is on before you estimate the work, because the same FHIR-based secure data exchange is routine on one and a project on another.
Importing outside records
One capability lags well behind the rest. In 2024, only 56% of hospitals allowed patients to import records from other organizations into their portal.
That figure is the patient-side mirror of the hospital integration gap. Data can reach a patient portal from its own health system far more reliably than it can arrive from anywhere else.
How Much Data Moves Through National Exchange Networks?
More than one billion health records have been exchanged through the TEFCA network, up from 10 million in less than a year, according to an HHS announcement dated 26 June 2026. TEFCA is the Trusted Exchange Framework and Common Agreement, the national framework for health information exchange between networks.
TEFCA growth
A hundred-fold increase inside a year makes TEFCA the fastest-moving number in this entire piece. It also arrives from a small base, so the current figure describes early scaling rather than a mature network.
Hospital participation moved just as fast. ASTP/ONC reported in February 2026 that in 2025, 80% of hospitals were participating in TEFCA or planning to, against 20% that were aware and participating in 2022. The share of hospitals unaware of TEFCA fell from 64% to 12% over the same period.
The QHIN network
Exchange under TEFCA runs through Qualified Health Information Networks. As of July 2026, 11 QHINs were designated by the Recognized Coordinating Entity, operated by The Sequoia Project. Applications remain open on a rolling basis, so the list changes.
For a product team, the practical question is which QHIN your partners already connect through, because that decides how much of the network you reach on day one.
TEFCA is the clearest example of government and industry efforts converging on one framework, and it is the closest the United States has come to nationwide routine interoperable exchange.
What Do Information Blocking Complaints Show?
Perceived information blocking is falling. ASTP Data Brief No. 85, published June 2026 with 2025 survey data, found the share of health information organizations reporting any perceived information blocking dropped from 91% in 2019 to 71% in 2025.
The decline is sharpest where the practice was most concentrated. Perceived blocking by certified health IT developers fell from 91% to 62%, and by hospitals and health systems from 58% to 49%.
By type of conduct, fees and pricing fell from 81% to 59%, artificial barriers from 65% to 40%, and restrictive contract language from 51% to 30%. Around one in five organizations still said blocking had a great impact on their exchange operations.
The survey covered 77 health information organizations at an 86% response rate, so read it as the view from the exchange operators rather than from providers.
The claims portal
Between April 2021 and July 2026, ASTP/ONC received 2,563 submissions through its information blocking portal, of which 2,450 were logged as claims of possible information blocking and 113 were not claims.
ASTP/ONC is explicit about what those numbers do and do not mean. In its own words: “Any claim ONC receives is simply an allegation or suggestion that information blocking has occurred. Logging a portal submission as a claim does not imply that an investigation has occurred or been started, or that any determination has been made as to whether information blocking has occurred.”
Read the figure as a measure of friction reported by patients, providers, and third parties over access to electronic patient health information, and nothing more. It is not a count of findings, and no organization named or unnamed should be treated as having been found responsible.
On the enforcement side, HHS and the Office of Inspector General issued a joint enforcement alert in September 2025. Health IT developers and networks face civil monetary penalties of up to one million dollars per violation under the OIG rule finalized in 2023.
How Does Interoperability Compare Across Countries?
The OECD published its most recent dedicated analysis, Health Working Paper No. 197, “Interoperability in healthcare”, on 23 July 2026. Its headline estimate: the full value of interoperability is worth between 2.7% and 6.6% of health expenditure annually.
The European Health Data Space
The European Union has put a fixed timetable behind cross-border exchange. Regulation (EU) 2025/327, the European Health Data Space (EHDS), entered into force on 26 March 2025.
Two dates matter for anyone building in or selling into Europe. From March 2029, cross-border exchange of patient summaries and ePrescriptions becomes operational. From March 2031, the second priority categories follow: medical images, laboratory results, and hospital discharge reports.
The global baseline
WHO reported in May 2025, when the World Health Assembly extended the Global Strategy on Digital Health to 2027, that 129 countries have established national digital health strategies, against 120 in 2020 and 85 in 2015. A further 130 Member States have completed digital health maturity assessments through the Global Digital Health Monitor.
Strategy adoption is close to universal. The WHO material measures whether countries have a plan rather than whether systems exchange data, so treat it as a policy baseline.
The OECD’s December 2025 working paper on personal health data systems is more concrete about what makes national access work. Finland reaches near-universal coverage of its patient record service by making provider reporting and HL7 FHIR adoption mandatory, and more than 90% of Australians have access to My Health Record. The paper’s own conclusion is that a health data authority backed by legislation is the common enabler.
What Is the Role of Artificial Intelligence in Patient Data Interoperability?
Federal surveys measure predictive Artificial Intelligence adoption in hospitals, but they do not measure Artificial Intelligence applied to record matching, data mapping, or record summarisation at all.
What the federal data does show: 71% of hospitals used predictive Artificial Intelligence integrated into their EHR in 2024, up from 66% in 2023, per ASTP Data Brief No. 80.
The measured use cases were clinical and operational: predicting health trajectories or inpatient risks (92%), identifying high-risk outpatients (78%), scheduling (67%), and billing (61%).
On oversight, 82% of hospitals evaluated their predictive models for accuracy and 74% evaluated them for bias.
Adoption is uneven along the same lines as exchange itself. Small hospitals were at 59% against 96% for large ones, rural 56% against urban 81%, and independent hospitals 37% against 86% for system-affiliated ones.
Generative and ambient tools
ASTP/ONC researchers published the first national generative Artificial Intelligence figure in December 2025. Using the same federal survey, they found 31.5% of hospitals had integrated generative Artificial Intelligence into their EHR, with a further 24.7% planning to inside a year. The same study reported that hospitals conducting less rigorous local evaluation were more likely to be early adopters, which is worth holding alongside the adoption number.
 Ambient documentation tools attack the burden that the Health Affairs finding above identified as the thing crowding out interoperability. A February 2026 JAMIA study of 167 physicians measured daily documentation time falling from 56.0 to 49.1 minutes, about 14%, with self-reported mental demand and effort both down. A 2025 study across two health systems found the share of clinicians meeting burnout criteria fell from 50.6% to 29.4% over 42 days.
Neither study measured whether the freed time went into reading outside records. That is the connection worth watching, and nobody has published it yet.
What peer-reviewed research shows
For seamless data integration and the interoperability tasks themselves, the evidence is single-site research rather than national statistics, and it is mixed. What healthcare professionals get from these tools today is a faster review rather than a finished one.
On patient record matching, a 2026 JAMIA study of 849,157 patients across two academic health centers found that a machine-learning privacy-preserving record linkage system reached 96.8% recall against 61.5% for the rule-based system it was compared with, at comparable precision.
On data mapping, results are weaker. A 2026 JAMIA study of automated LOINC mapping using biomedical natural language processing models reported best-case coverage of 54.4%, with other approaches below 43%. Automated mapping is a review accelerator at these rates, and it does not replace a clinical reviewer.
Two limits apply to all of it. These are single-institution or two-institution studies rather than national measurements, and any model applied to clinical records assists people under human oversight. It does not make clinical decisions.
Ready to Build Healthcare Products That Actually Exchange Data? Our Experience
The numbers above describe the problem your product has to solve. Sending is close to universal and integration is not, which means the difficult work sits on your side of the connection rather than the sending system’s.
We build FHIR-native healthcare integrations and EHR products. We built a telemedicine platform on Medplum with a Health Gorilla integration, which is one of the 11 designated QHINs, so clinical and lab data reaches the product through a standards-based connection. Our work spans Medplum development and custom EHR/EMR development, and the general standards picture behind all of it is covered in our guide to healthcare data interoperability.
HIPAA-compliant app built with Medplum to support early cancer detection

Wrapping Up
Four findings carry most of the meaning in this data.
First of all, the exchange plumbing is largely built. 96% of hospitals send records electronically and 94% can query for them, against 78% and 48% a decade ago.
Second, integration is the real bottleneck. 79% of hospitals integrate received records without manual entry, a figure statistically unchanged since 2023, and 39% still report that exchange requires customized interfaces.
Patient-facing access is mainstream but fragmented. 65% of individuals reach their records, while 59% hold them across multiple portals and 7% use anything to combine them.
National exchange volume is scaling fast from a small base, with more than one billion records through TEFCA and 11 designated QHINs.
Exchange outside the hospital is the thinnest layer of all: in 2025, hospitals sent to most or all external hospitals at 69% but to behavioral health facilities at 22%.
If you are scoping a product that has to exchange clinical data, the integration and setting-level figures are the ones worth designing against. Truly interoperable systems are measured by whether relevant patient health information arrives where the next decision gets made, and the national numbers say that is still the exception outside the hospital.
We're here to help

FAQ

The four domains of interoperable healthcare data exchange are sending, receiving, finding, and integrating patient health information electronically. ASTP/ONC measures US hospitals against all four. In 2025, 76% of non-federal acute care hospitals engaged in all four, with integrating the lowest individual domain at 79%.
The barriers hospitals report are more practical rather than attitudinal. In 2025, 39% of hospitals said exchange required customized interfaces, 25% reported data formatting problems, and 21% said they had difficulty locating the right provider. Data that takes effort to retrieve and reconcile competes with everything else in a clinical workflow. At the same time, fragmented systems contribute to cognitive overload for about 61% of healthcare providers.
In 2024, 70% of US hospitals enabled patient access through apps configured to meet Fast Healthcare Interoperability Resources (FHIR) specifications, and 81% enabled access through apps meeting broader API specifications. Both figures come from ASTP Data Brief No. 79, published in August 2025.
TEFCA is the Trusted Exchange Framework and Common Agreement, the US national framework for health information exchange between networks. HHS announced in June 2026 that more than one billion health records had been exchanged through TEFCA, up from 10 million less than a year earlier. Exchange runs through Qualified Health Information Networks, of which 11 were designated as of July 2026.
The largest measured barrier in healthcare data interoperability is integration. In 2025, 96% of US hospitals sent records electronically, while 79% could integrate a received record without manual entry, and that integration figure has been statistically unchanged since 2023. The most-reported specific barrier is the need for customized interfaces, cited by 39% of hospitals in 2025. Also, routine engagement in interoperable exchange has increased by 54% since 2018.